Ewa Grabska-Szwagrzyk
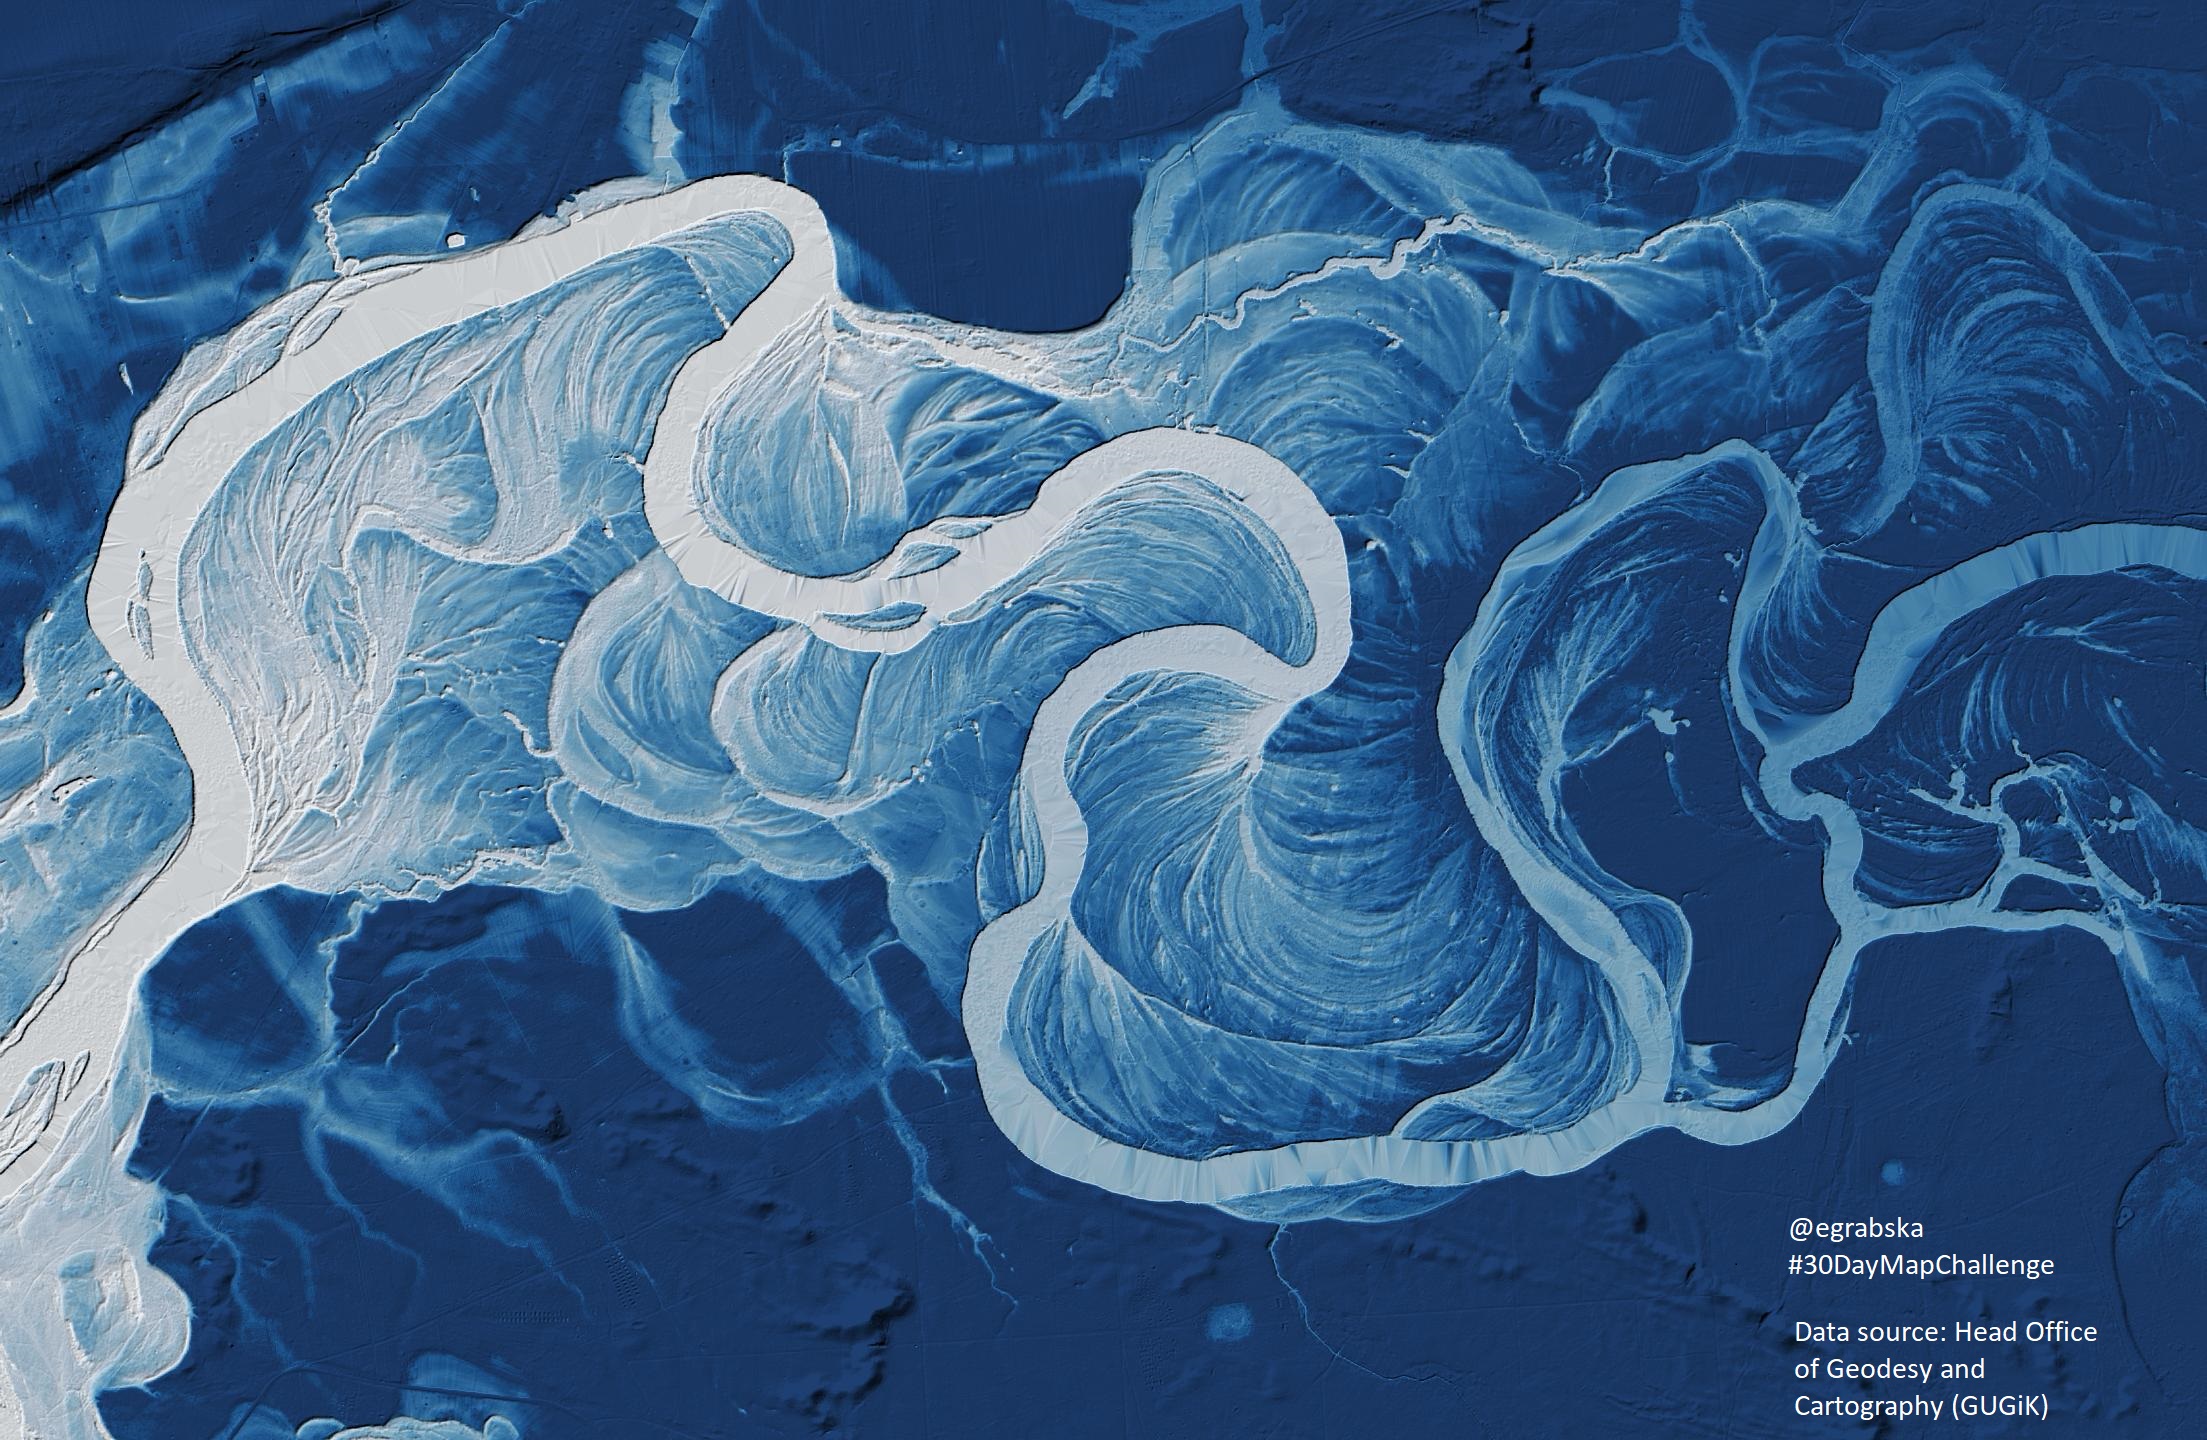
Meanders of Bug river in Poland - actual and former channel courses depicted using hillshade and elevation - made in QGIS with elevation data from GUGIK Poland.
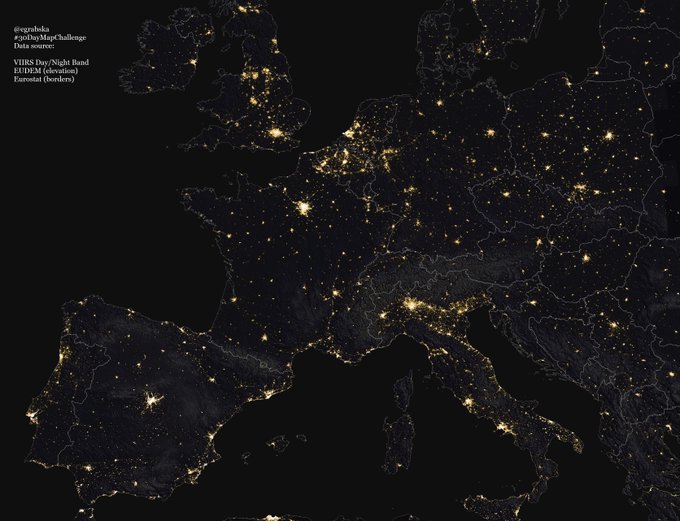
Urban areas in Europe - visualization of night lights from Visible Infrared Imaging Radiometer Suite (VIIRS) downloaded from Google Earth Engine, made in QGIS.
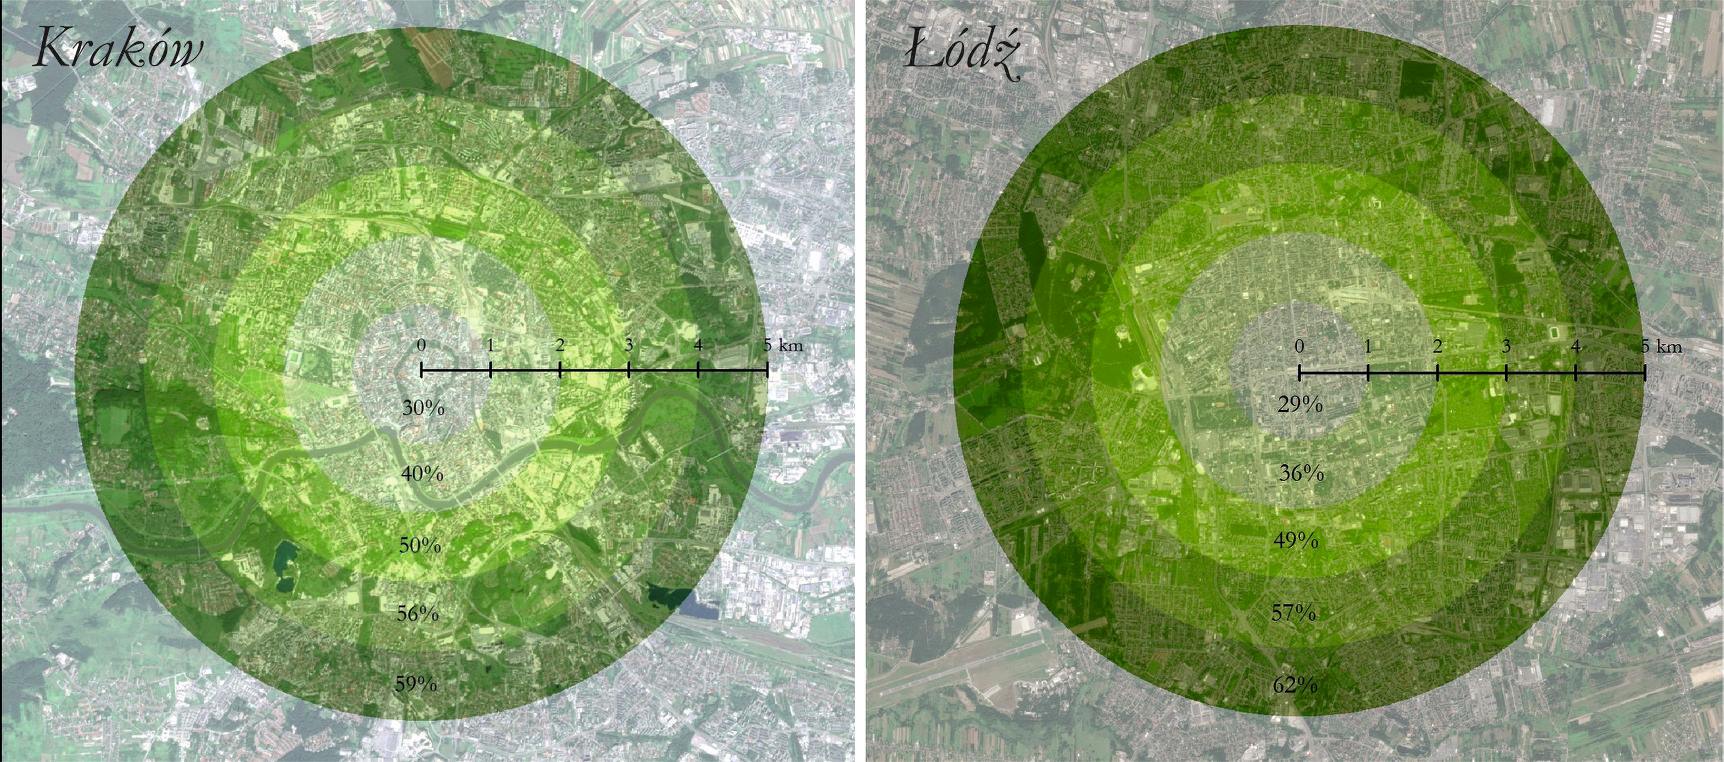
Percentage of green areas in Polish cities, calculated using NDVI in ArcGIS derived from Sentinel-2 imagery from ESA Copernicus Programme.
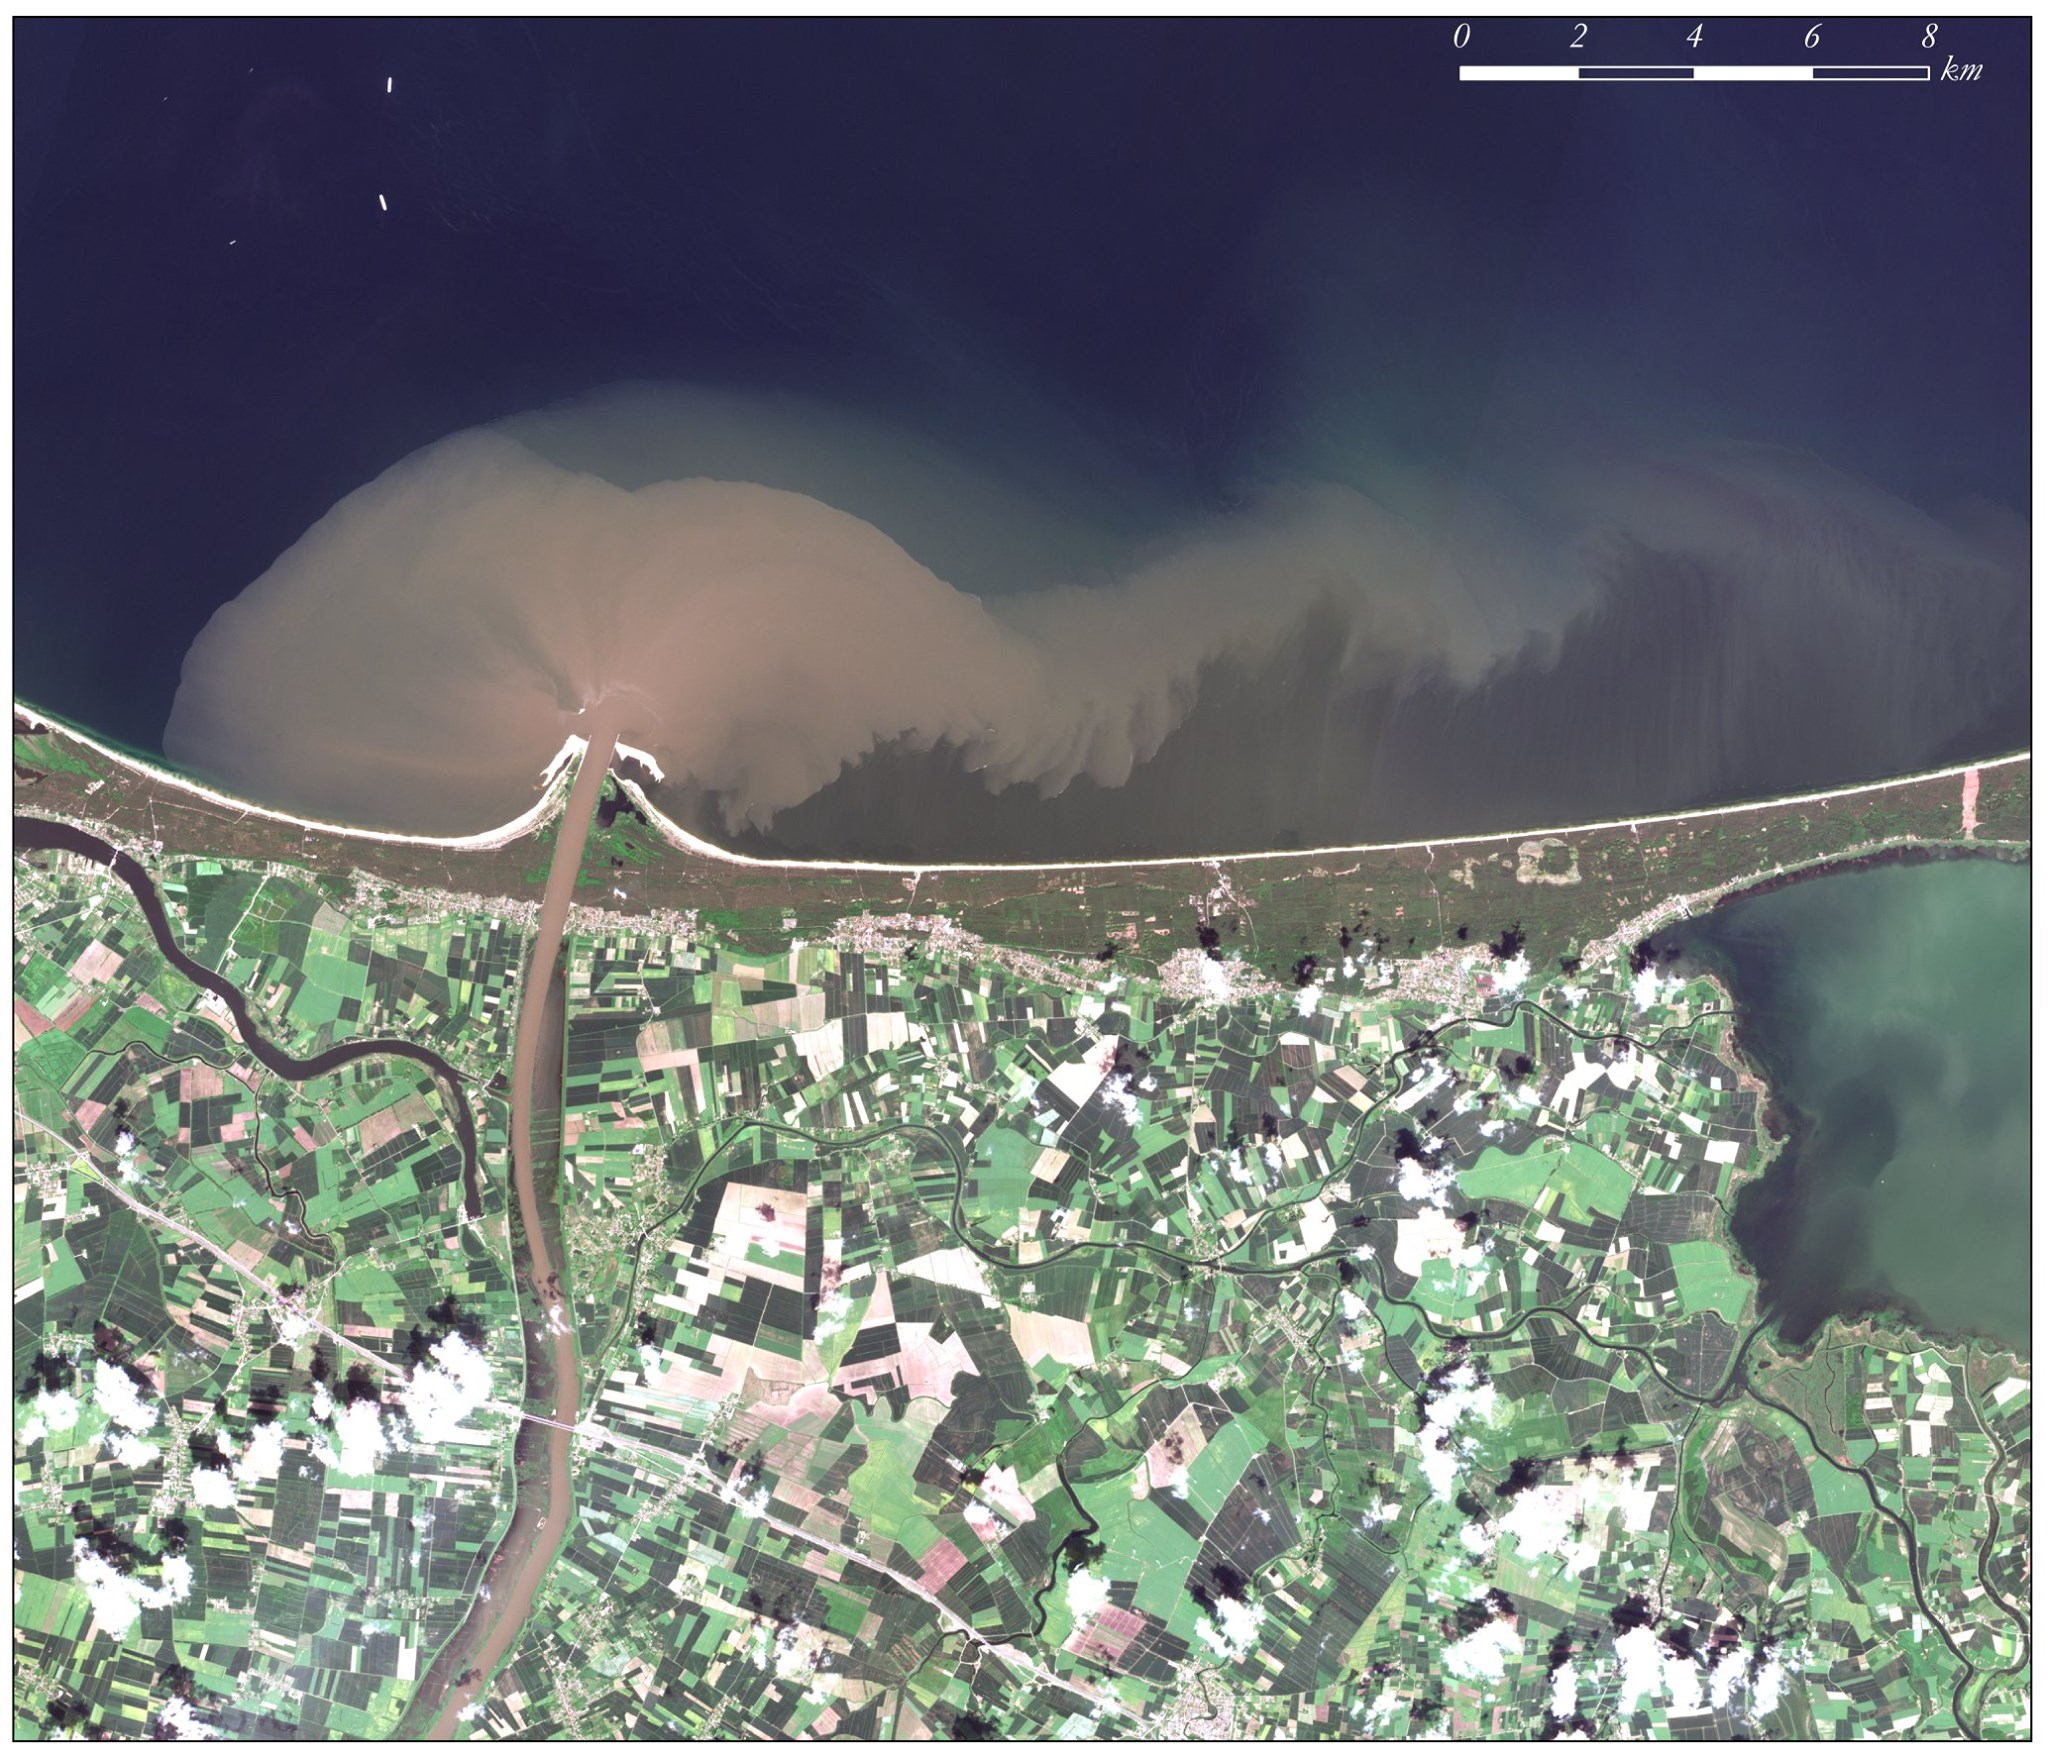
Flood wave flowing into the Baltic Sea, visualization of Sentinel-2 imagery from ESA Copernicus Programme in ArcGIS.
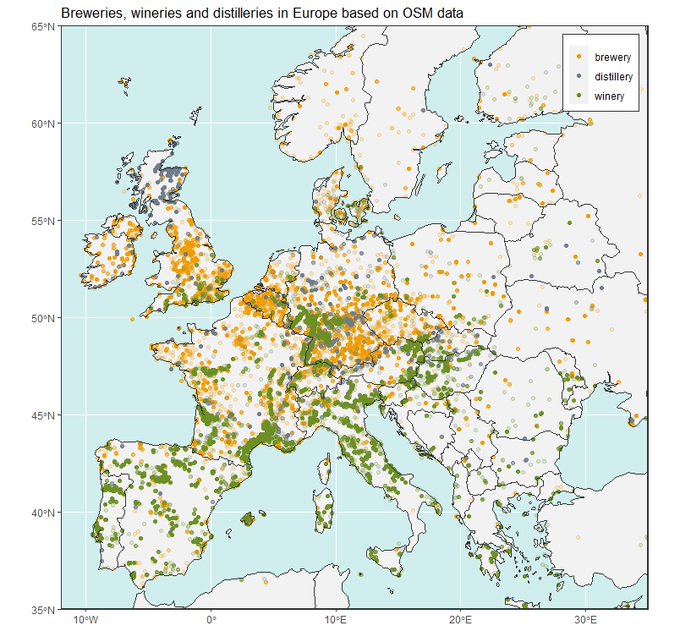
Map of breweries 🍺, wineries 🍷 and distilleries 🥃 locations in Europe. Made in R from OpenStreetMap data using osmadata and ggplot2 packages.